Past, Present, and Trends
Who are we?
• Oldest commodity reporting company in the U.S.
• Reporting the commodity market since 1848
• Started with a printing company
– Manhattan New York, NY
– Market canvass
So, what do we do, and how do we do it?
• Market Canvass through
– Reporters and Analysts gathering:
• Quantitative data
• Qualitative data
• Arrive at quote that represents the bulk of trading
• Brings transparency to the market
• Therefore, brings efficiency
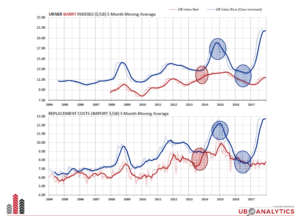
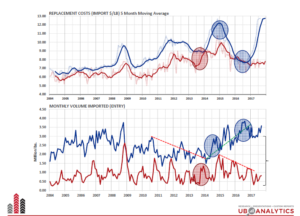
Specifics on Prices
• Spot market prices
– LTL trades (avg. 2,000-3,000 lbs. Per trade, ex. Salmon and other items specified)
– Different FOB points
» Ports
» Cities
» Regions
• Only sales, bids and offers for cash terms are accepted for consideration.
• No distressed product, or product offered or bought under distressed conditions, is acceptable.
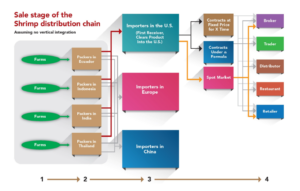
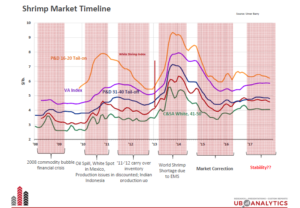
To understand where we are… we must go back to 2013
4 Events take place:
• #1 Shrimp Supplier (not producer) loses over 45% of their production
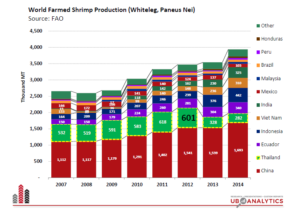
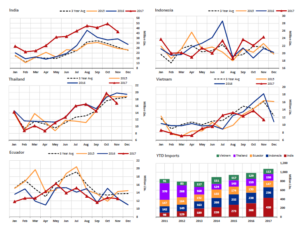
• 3 major producers expand their production during this supply shock (India, Indonesia, Ecuador)
• China’s production, allegedly remains flat
• Chinese demand increases rapidly
• Upward Price pressure in Q1; summer spike
– Market prices firm into Q2
– Slope of upward trend turns steep
• Seasonal imports take a dip
• Emerging markets enter the market place; China
• Implosion of EMS
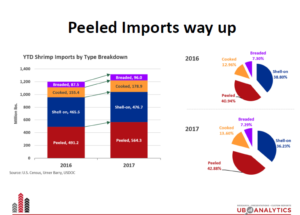
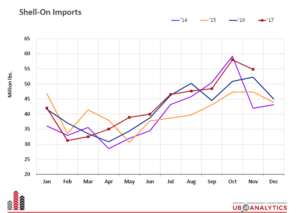
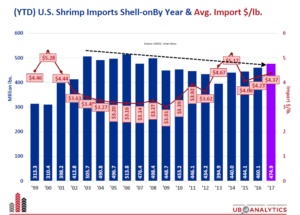
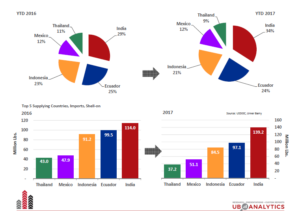
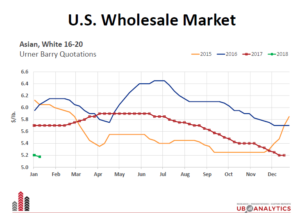
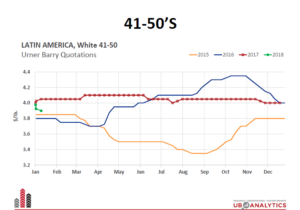
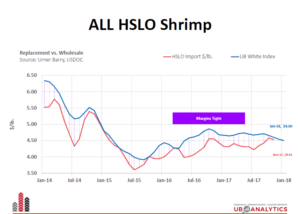
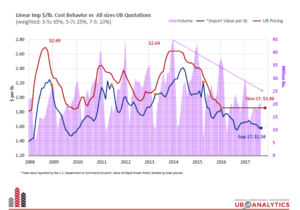
Shell-on (Headless) HSLO Shrimp
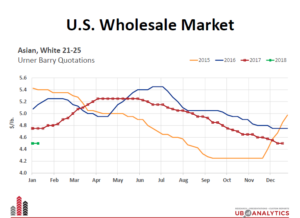
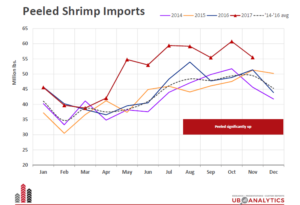
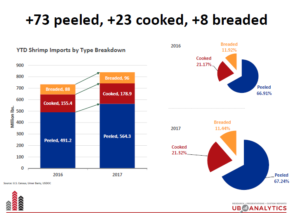
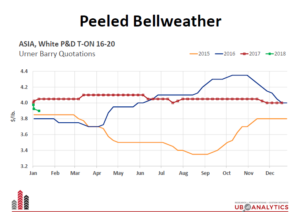
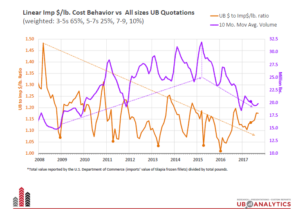
Peeled Shrimp
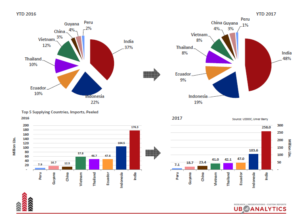
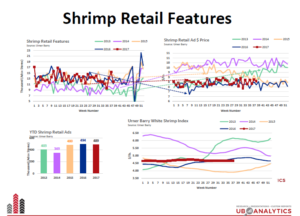
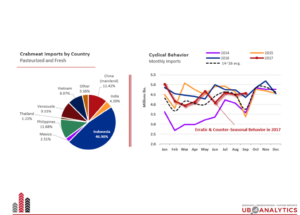
Shrimp Conclusions
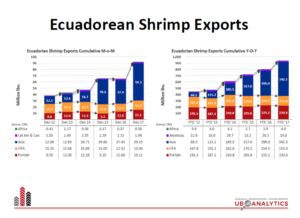
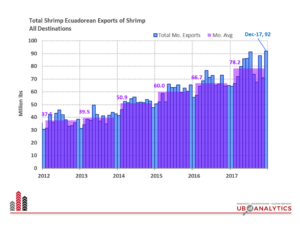
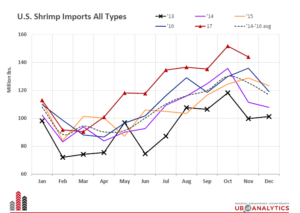
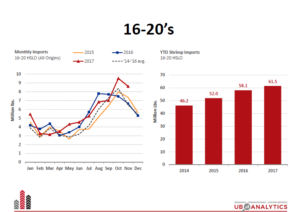
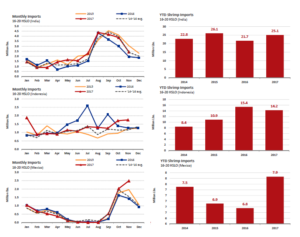
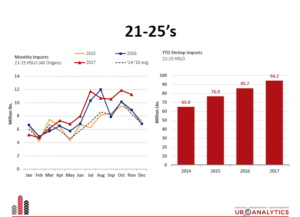
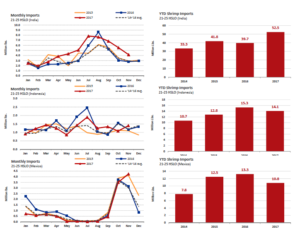
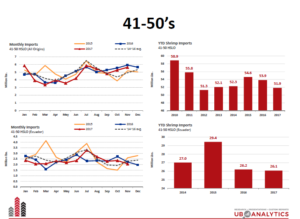
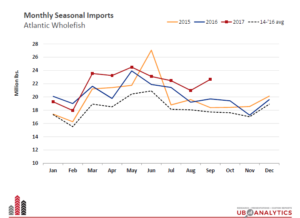
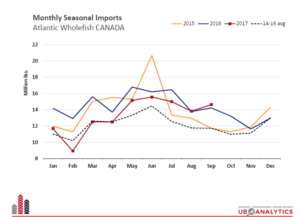
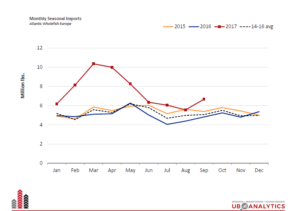
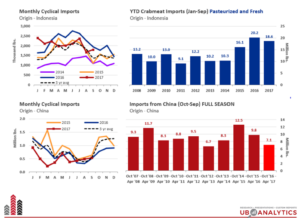
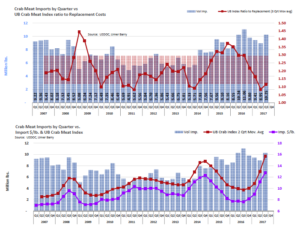
• Imports highly seasonal
• Transition from HSLO, to value-added
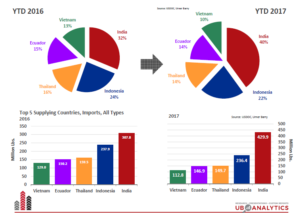
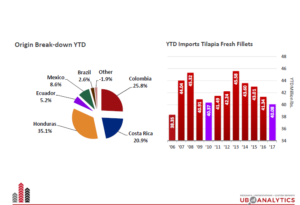
• India main supplier of all types
• Ecuador shipping most of its volume to China
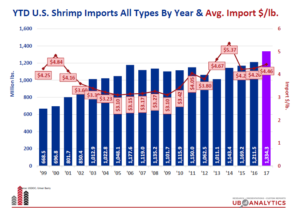
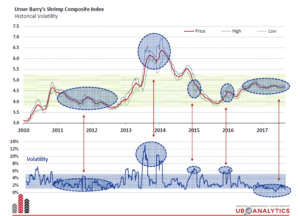
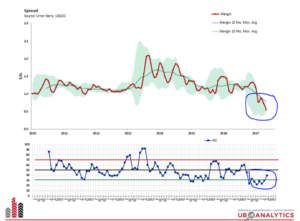
• After price crash (ems) market is very steady
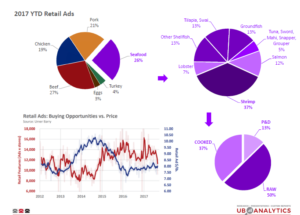
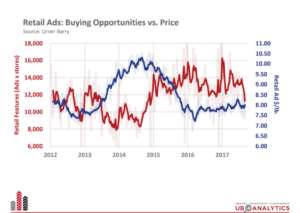
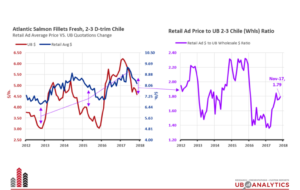
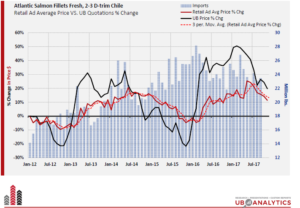
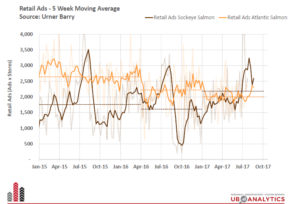
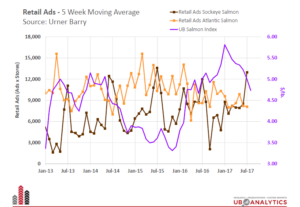
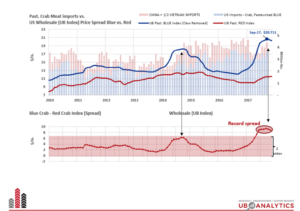
• Wholesale mkt vs. Retail ads & Price

Source: Society of Aquaculture Professionals (SAP)